Company: EverQuote, Inc
Symbol: EVER
Description: They operate the largest online marketplace for insurance shopping in the United States.
Trade Date: 6/28
Shares: 4.7 million
Price Range: $15.00-$17.00
Underwriter(s): J.P Morgan, BofA Merrill Lynch
Co-Manager(s): Canaccord Genuity, JMP Securities, Needham & Company Oppenheimer & Co., Raymond James, William Blair
Terms Added: 6-18-18
Business: They operate the largest online marketplace for insurance shopping in the United States. Their goal is to reshape insurance shopping for consumers and improve the way insurance providers attract and connect with customers as insurance shopping continues to shift online. With over 10 million consumer visits per month, their results-driven marketplace, powered by their proprietary data and technology platform, matches and connects consumers seeking to purchase insurance with relevant options from their broad direct network of insurance providers, saving consumers and providers time and money. Their network includes more than 160 insurance carriers, including the 20 largest property and casualty carriers by premium volume, over 100 leading regional carriers and technology-enabled insurance startups, as well as more than 7,000 insurance agencies. As of April 30, 2018, their marketplace has converted more than 240 million consumer visits into over 35 million auto, home and life insurance quote requests.
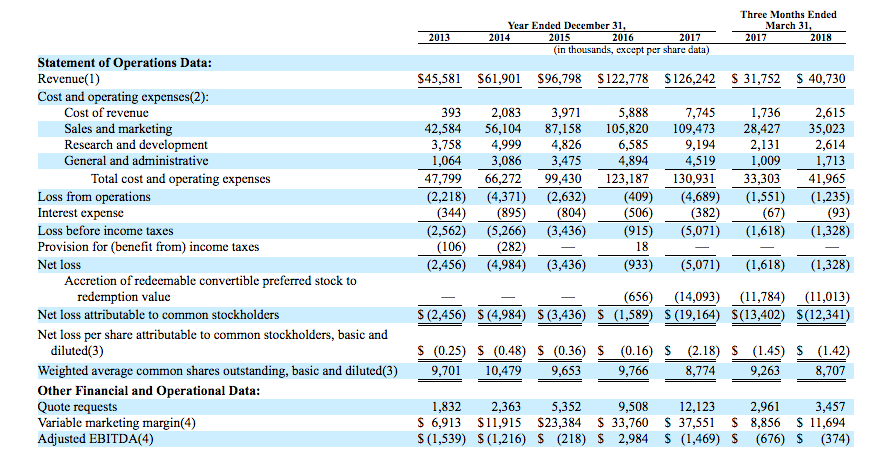
Financials: They rapidly scaled their business in a capital-efficient manner, having grown their company to revenue of over $125 million in 2017 with less than $10 million of equity raised to finance their business. Their revenue grew from $45.6 million in 2013 to $126.2 million in 2017, representing a compound annual growth rate of 29.0%. In 2016 and 2017, their total revenue was $122.8 million and $126.2 million, respectively, representing year-over-year growth of 2.8%. In the three months ended March 31, 2017 and 2018, their revenue was $31.8 million and $40.7 million, respectively, representing quarter-over-quarter growth of 28.3%. They had a net loss of $0.9 million in 2016 and a net loss of $5.1 million in 2017, and had $3.0 million and $(1.5) million in adjusted EBITDA in 2016 and 2017, respectively. They had net losses of $1.6 million and $1.3 million for the three months ended March 31, 2017 and 2018, respectively, and had $(0.7) million and $(0.4) million in adjusted EBITDA for the three months ended March 31, 2017 and 2018, respectively.
Book-Building Status: The way the book comes together during the week of the roadshow is the most critical indicator to first-day and first-week performance. IPO Boutique uses its 45 years of experience and sources all over the street to gather daily subscription levels, specific price guidance and what type of investors are currently in the book or are anchoring orders in the book. In addition, recent underwriter performance on sector specific deals is a strong factor that IPO Boutique takes into account when determining if our clients should indicate for any offering.
IPO Boutique subscription clients receive daily updates on this critical information.
Conclusion: IPO Boutique provides ratings, daily commentary and a forecast for how this IPO will open vs. its offering price. We have kept a track record with our performance for last 12 years at our website. Additionally, here’s a 2017 recap of our performance to showcase the value of IPO Boutique’s service.
Indicate with confidence, SUBSCRIBE today.

